Stats overview
Net P&L, drawdown, the key tiles, streaks, where your edge is (tap a row to filter), when you trade, R per trade, discipline and mistakes.
Stats → Overview shows the selected account's results for the period you pick. Every figure uses the same definitions as the Dashboard — see How stats are calculated.
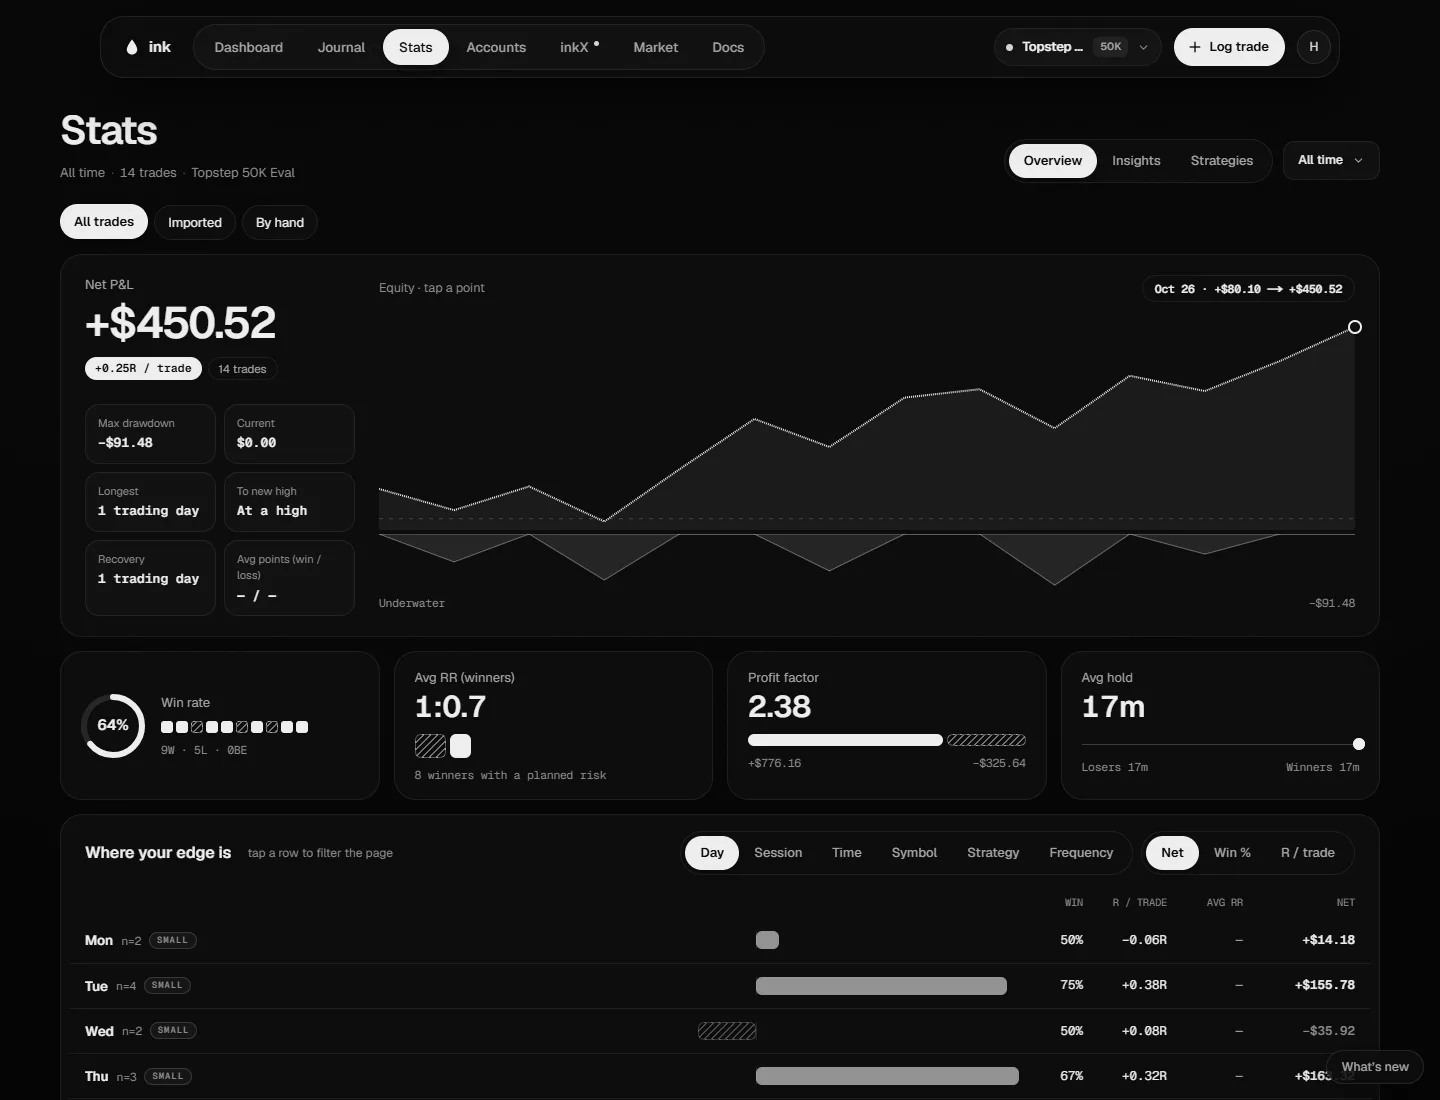
All trades, Imported or By hand at the top limits the whole page to trades from that source.
What's on it
- Net P&L — with your R / trade, the trade count and the equity line. Beside it: Max drawdown, Current drawdown, the Longest one (in trading days), To new high ("At a high" when you're there), Recovery and Avg points (win / loss) (points per contract; breakevens left out; "—" when the trades mix instruments, since an ES point isn't an NQ point — pick one under Symbol). See Drawdown and recovery.
- Win rate — with your last trades (wins, losses, breakevens), Avg RR (winners), Profit factor (gross won vs gross lost) and Avg hold (losers vs winners).
- Streaks and extremes — the row of small tiles below. See Streaks and extremes.
- Where your edge is — your trades grouped by Day (the weekday they closed), Session (the one you tagged; untagged trades are Unassigned), Time (the hour they opened), Symbol, Strategy or Frequency (your days by how many trades you opened: 1-2 trades/day, 3-4 trades/day, 5+ trades/day), and seven more under More. Measure each by Net, Win % or R / trade. A row with fewer than 10 trades is marked Small: the numbers are real, but too few to lean on.
- When you trade — a weekday × hour map of your net, with your busiest hour and its win rate.
- R per trade — how your trades' R spread out.
- Discipline — win rate and net when you follow your rules vs when you break them, what broken rules cost you, and what each mistake cost you. It says "Early read · needs 10 trades each side" until both sides have 10. See Trading rules and discipline.
Streaks and extremes
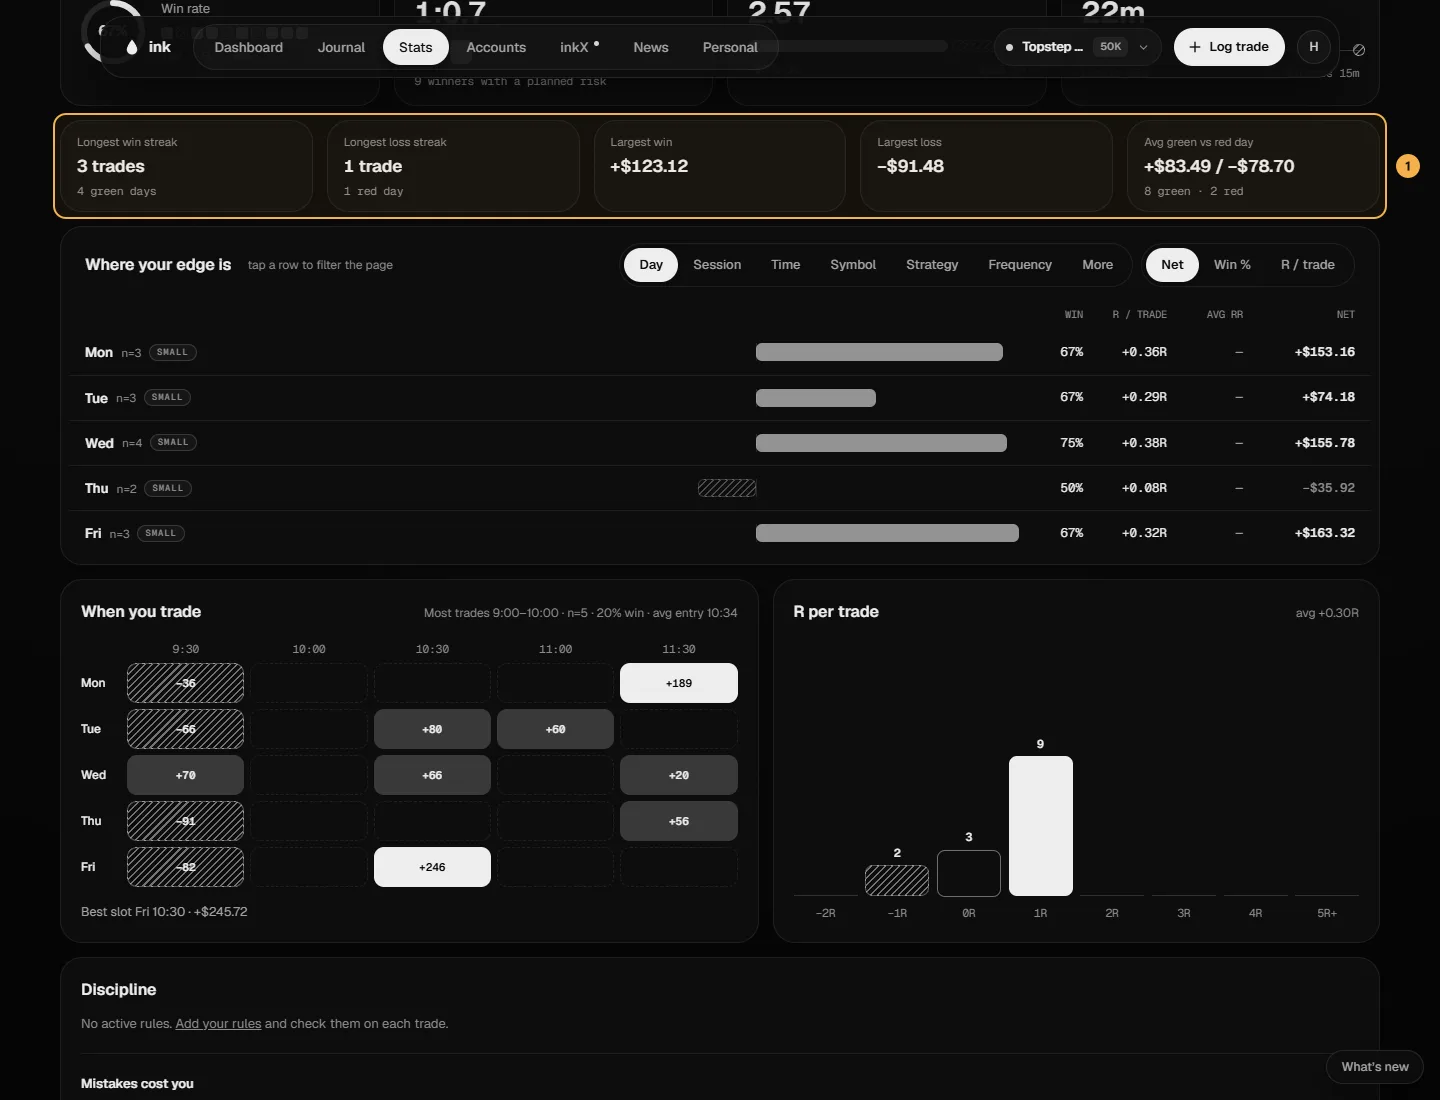
- Longest win streak / Longest loss streak — the most winning (or losing) trades in a row, and under it the most green (or red) trading days in a row. A breakeven trade or day ends a streak. Days without trades don't.
- Largest win / Largest loss — your single best and worst trade.
- Avg green vs red day — the average net of your green days next to the average net of your red days, with how many of each.
A day is the date the trades closed. Win, loss and breakeven follow your breakeven band, like everywhere else.
More groupings
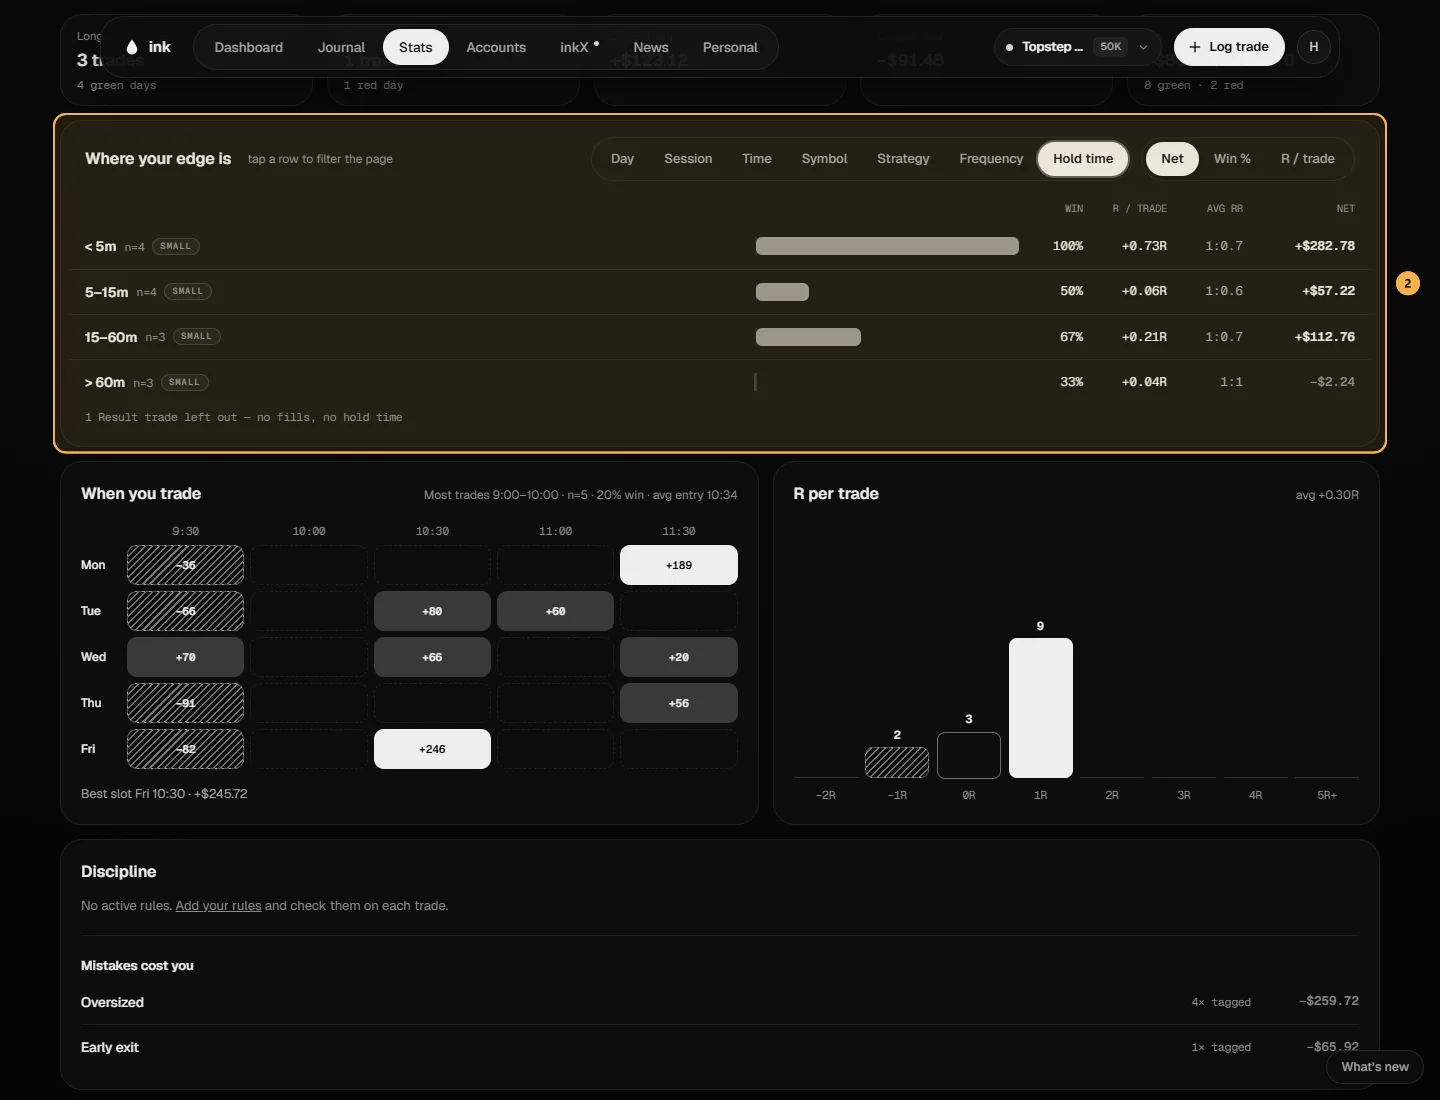
More at the end of the grouping control opens seven more ways to group your trades:
- Hold time — how long the trade was open, in real time: under 5 minutes, 5–15, 15–60 (a trade held exactly 60 minutes is in this row) and over 60. Only trades logged with fills have a hold time. Trades logged as a result are left out, and a line under the rows says how many ("1 Result trade left out — no fills, no hold time").
- Size — the number of contracts.
- Month — the month the trade closed.
- Week of month — the week of the month the trade closed, counted from the 1st: days 1–7 are Week 1, 8–14 Week 2, 15–21 Week 3, 22–28 Week 4, and 29–31 Week 5 (shown only when it has trades).
- Long / Short — the side.
- Feelings and Mistakes — the feeling and mistake tags on your trades (from a trade's page). A trade with two feelings, or two mistakes, counts in both rows. Trades with none are Not tagged.
The button shows the grouping you picked. Its rows can be tapped like any other.
Mistakes cost you
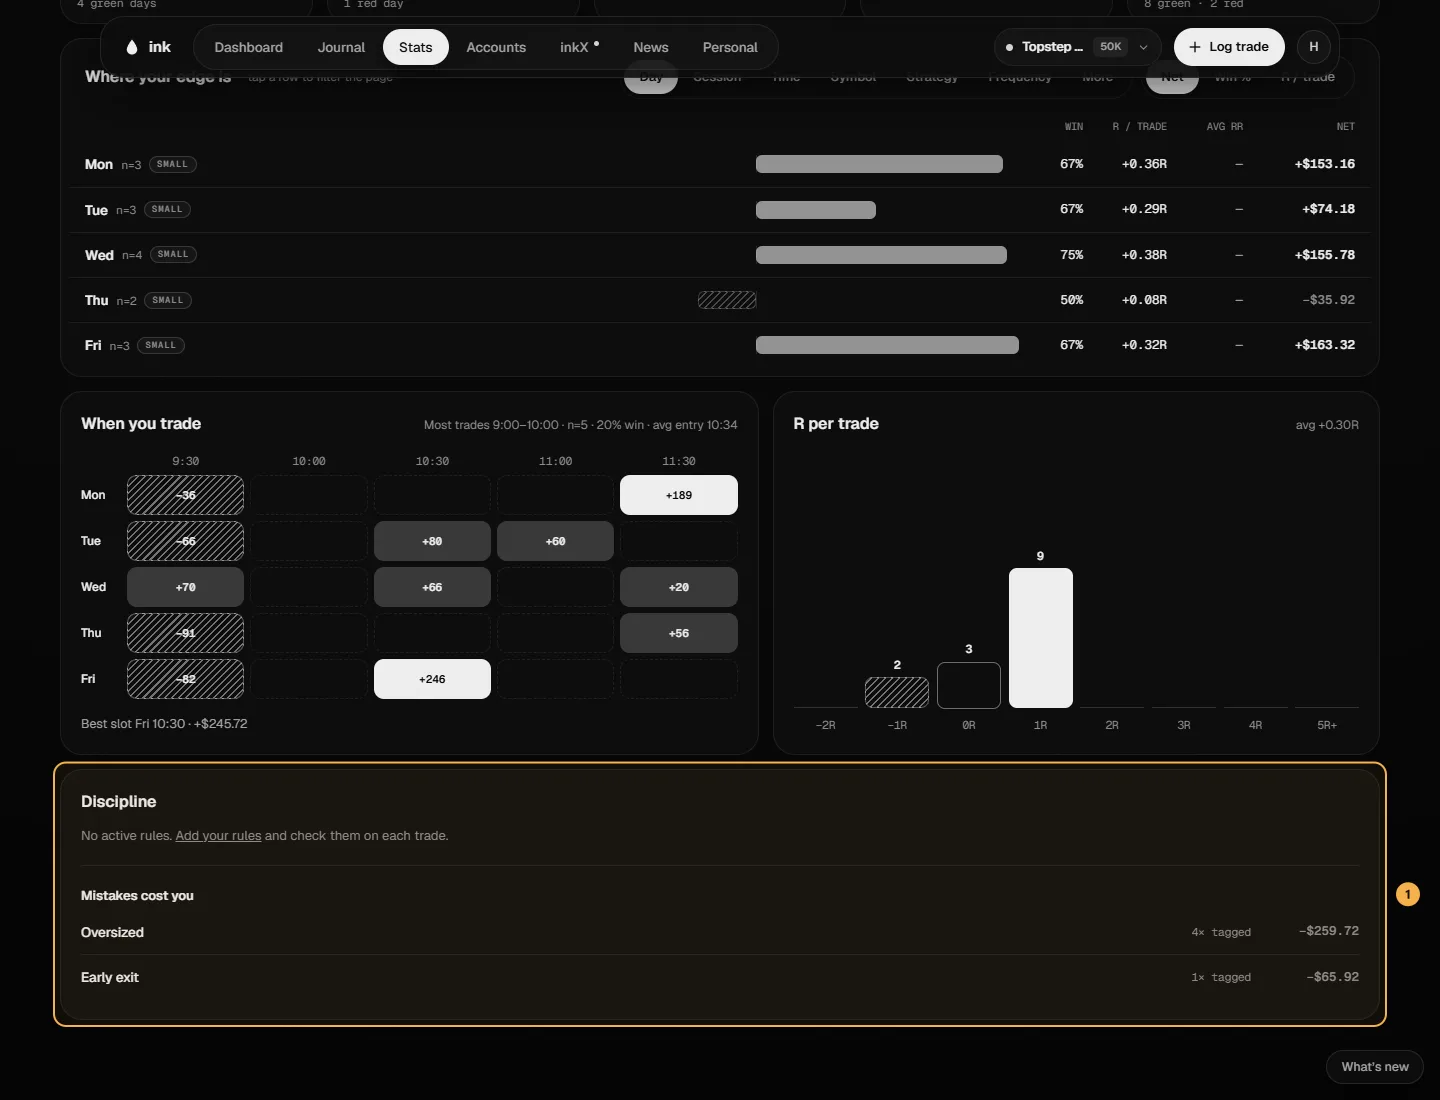
Under Discipline, Mistakes cost you lists each mistake tag on this period's trades: how many trades carry it and their net, costliest first. "No mistake" is an answer, not a mistake, so it isn't listed. A trade with two mistakes counts under both.
Tap a row to filter
Tap a row in Where your edge is, say Tuesday, and every figure on the page is worked out again over just those trades: "Showing Tuesday". Tap it again, or the ✕, to show every trade.
On the Free plan
Stats covers your full history (or the last 7 or 30 days): net P&L, the equity curve and the drawdown block, R / trade, win rate, Avg RR (winners), profit factor, and the streaks and extremes tiles. A strip at the top shows what more trades open up — First trade, Your days, Win rate & PF, Insights (20 trades) and Strategy edge (30 strategy-tagged trades).
The edge finder, Avg hold, When you trade, R per trade and Discipline (with Mistakes cost you) are Pro: on Free they show blurred shapes — never your numbers — under a Pro card. Compare, Insights and Tags carry a lock.